A2 Municipal Electricity Voting Patterns
Proposal E, the municipal electric utility charter amendment, lost citywide 51.8% to 48.2% (28,414 No to 26,411 Yes), and that narrow margin translates into a clear geographic pattern: 35 of 52 neighborhoods voted No, 17 voted Yes.
Please reply with data corrections.
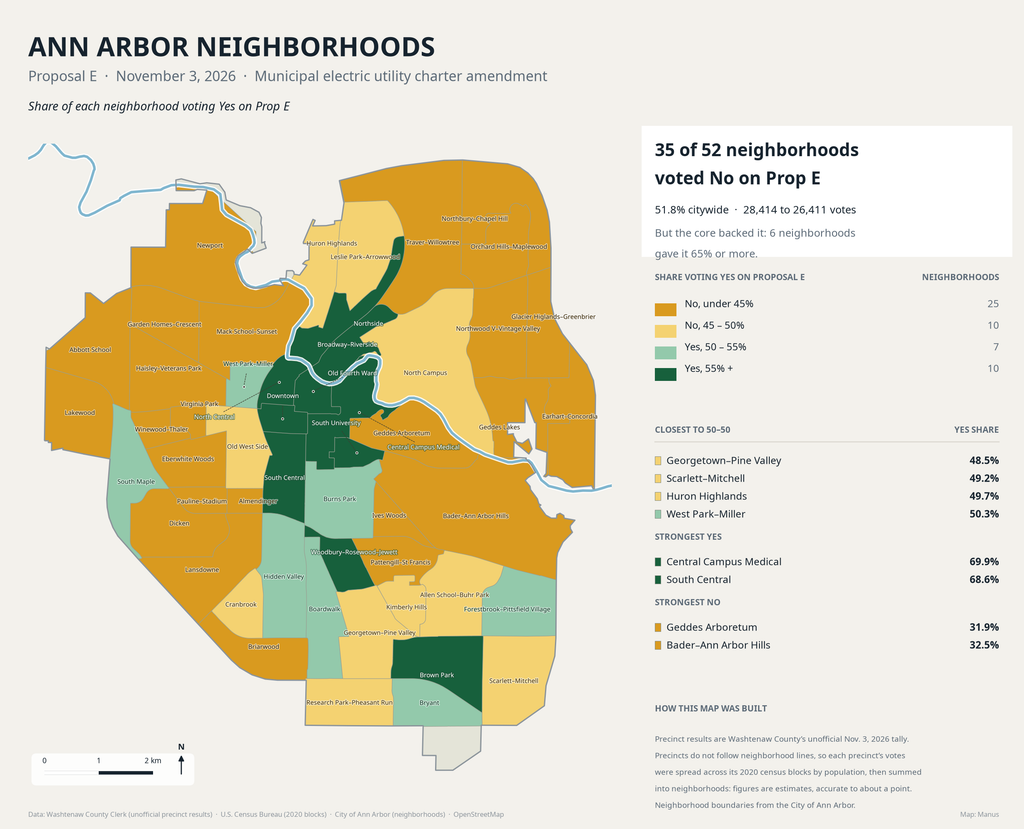
The Yes vote is packed into the urban core and the campus rental belt. Central Campus Medical led at 69.9%, followed by South Central (68.6%), Old Fourth Ward (67.7%), Broadway–Riverside (67.6%), South University (66.0%) and Downtown (65.1%) — six neighborhoods at 65% or better. A secondary Yes band runs through the near-south and near-west: Brown Park (56.4%), Northside (55.9%), Woodbury–Rosewood–Jewett (55.4%), Burns Park (54.4%), South Maple and Hidden Valley (53.9%), Boardwalk (52.1%), Bryant (51.6%).
The No side dominated the low-density, owner-occupied edges — Geddes Arboretum (31.9% Yes), Bader–Ann Arbor Hills (32.5%), Newport (33.1%), Glacier Highlands–Greenbrier and Northwood V–Vintage Valley (36.8%), Dicken (38.1%), Briarwood and Lansdowne (38.4%).
One detail worth flagging: at precinct level Prop E actually carried 19 of 41 precincts, yet only 17 of 52 neighborhoods. The Yes vote was concentrated in a few dense central precincts, which is why 48% of the citywide vote converted into barely a third of neighborhoods.
The shading carries the margin rather than a flat two-color split — deep green for Yes above 55%, light green for Yes in the low 50s, pale yellow for No between 45 and 50%, and amber for No below 45%. Fifteen neighborhoods land within five points of 50/50, so treat those lightest polygons as statistical ties given the estimation method (precinct totals redistributed to 2020 census blocks by population; roughly ±1 point per neighborhood, unofficial county tally through Nov. 3).
| neighborhood | yes_votes | no_votes | total_votes | yes_pct | result |
| Central Campus Medical | 910 | 391 | 1301 | 69.9 | Yes |
| South Central | 1408 | 644 | 2052 | 68.6 | Yes |
| Old Fourth Ward | 777 | 371 | 1148 | 67.7 | Yes |
| Broadway–Riverside | 507 | 243 | 750 | 67.6 | Yes |
| South University | 703 | 362 | 1065 | 66 | Yes |
| Downtown | 467 | 251 | 718 | 65 | Yes |
| North Central | 333 | 182 | 515 | 64.7 | Yes |
| Brown Park | 551 | 426 | 977 | 56.4 | Yes |
| Northside | 432 | 341 | 773 | 55.9 | Yes |
| Woodbury–Rosewood–Jewett | 457 | 368 | 825 | 55.4 | Yes |
| Burns Park | 1605 | 1347 | 2952 | 54.4 | Yes |
| South Maple | 490 | 419 | 909 | 53.9 | Yes |
| Hidden Valley | 334 | 286 | 620 | 53.9 | Yes |
| Boardwalk | 37 | 34 | 71 | 52.1 | Yes |
| Forestbrook–Pittsfield Village | 680 | 636 | 1316 | 51.7 | Yes |
| Bryant | 652 | 613 | 1265 | 51.5 | Yes |
| West Park–Miller | 394 | 389 | 783 | 50.3 | Yes |
| Huron Highlands | 382 | 387 | 769 | 49.7 | No |
| Scarlett–Mitchell | 646 | 668 | 1314 | 49.2 | No |
| Georgetown–Pine Valley | 704 | 748 | 1452 | 48.5 | No |
| North Campus | 731 | 786 | 1517 | 48.2 | No |
| Cranbrook | 321 | 355 | 676 | 47.5 | No |
| Leslie Park–Arrowwood | 445 | 497 | 942 | 47.2 | No |
| Old West Side | 1007 | 1163 | 2170 | 46.4 | No |
| Allen School–Buhr Park | 429 | 508 | 937 | 45.8 | No |
| Kimberly Hills | 362 | 437 | 799 | 45.3 | No |
| Research Park–Pheasant Run | 197 | 240 | 437 | 45.1 | No |
| Traver–Willowtree | 901 | 1113 | 2014 | 44.7 | No |
| Northbury–Chapel Hill | 777 | 966 | 1743 | 44.6 | No |
| Virginia Park | 276 | 343 | 619 | 44.6 | No |
| Haisley–Veterans Park | 1023 | 1271 | 2294 | 44.6 | No |
| Winewood–Thaler | 313 | 390 | 703 | 44.5 | No |
| Abbott School | 675 | 865 | 1540 | 43.8 | No |
| Orchard Hills–Maplewood | 441 | 602 | 1043 | 42.3 | No |
| Garden Homes–Crescent | 365 | 509 | 874 | 41.8 | No |
| Pattengill–St Francis | 500 | 713 | 1213 | 41.2 | No |
| Ives Woods | 172 | 246 | 418 | 41.1 | No |
| Pauline–Stadium | 261 | 375 | 636 | 41 | No |
| Almendinger | 169 | 244 | 413 | 40.9 | No |
| Eberwhite Woods | 499 | 723 | 1222 | 40.8 | No |
| Geddes Lakes | 248 | 367 | 615 | 40.3 | No |
| Lakewood | 330 | 490 | 820 | 40.2 | No |
| Earhart–Concordia | 212 | 318 | 530 | 40 | No |
| Mack School–Sunset | 552 | 836 | 1388 | 39.8 | No |
| Lansdowne | 445 | 714 | 1159 | 38.4 | No |
| Briarwood | 192 | 309 | 501 | 38.3 | No |
| Dicken | 697 | 1132 | 1829 | 38.1 | No |
| Northwood V–Vintage Valley | 157 | 271 | 428 | 36.7 | No |
| Glacier Higlands–Greenbrier | 157 | 271 | 428 | 36.7 | No |
| Newport | 251 | 508 | 759 | 33.1 | No |
| Bader–Ann Arbor Hills | 675 | 1400 | 2075 | 32.5 | No |
| Geddes Arboretum | 162 | 346 | 508 | 31.9 | No |